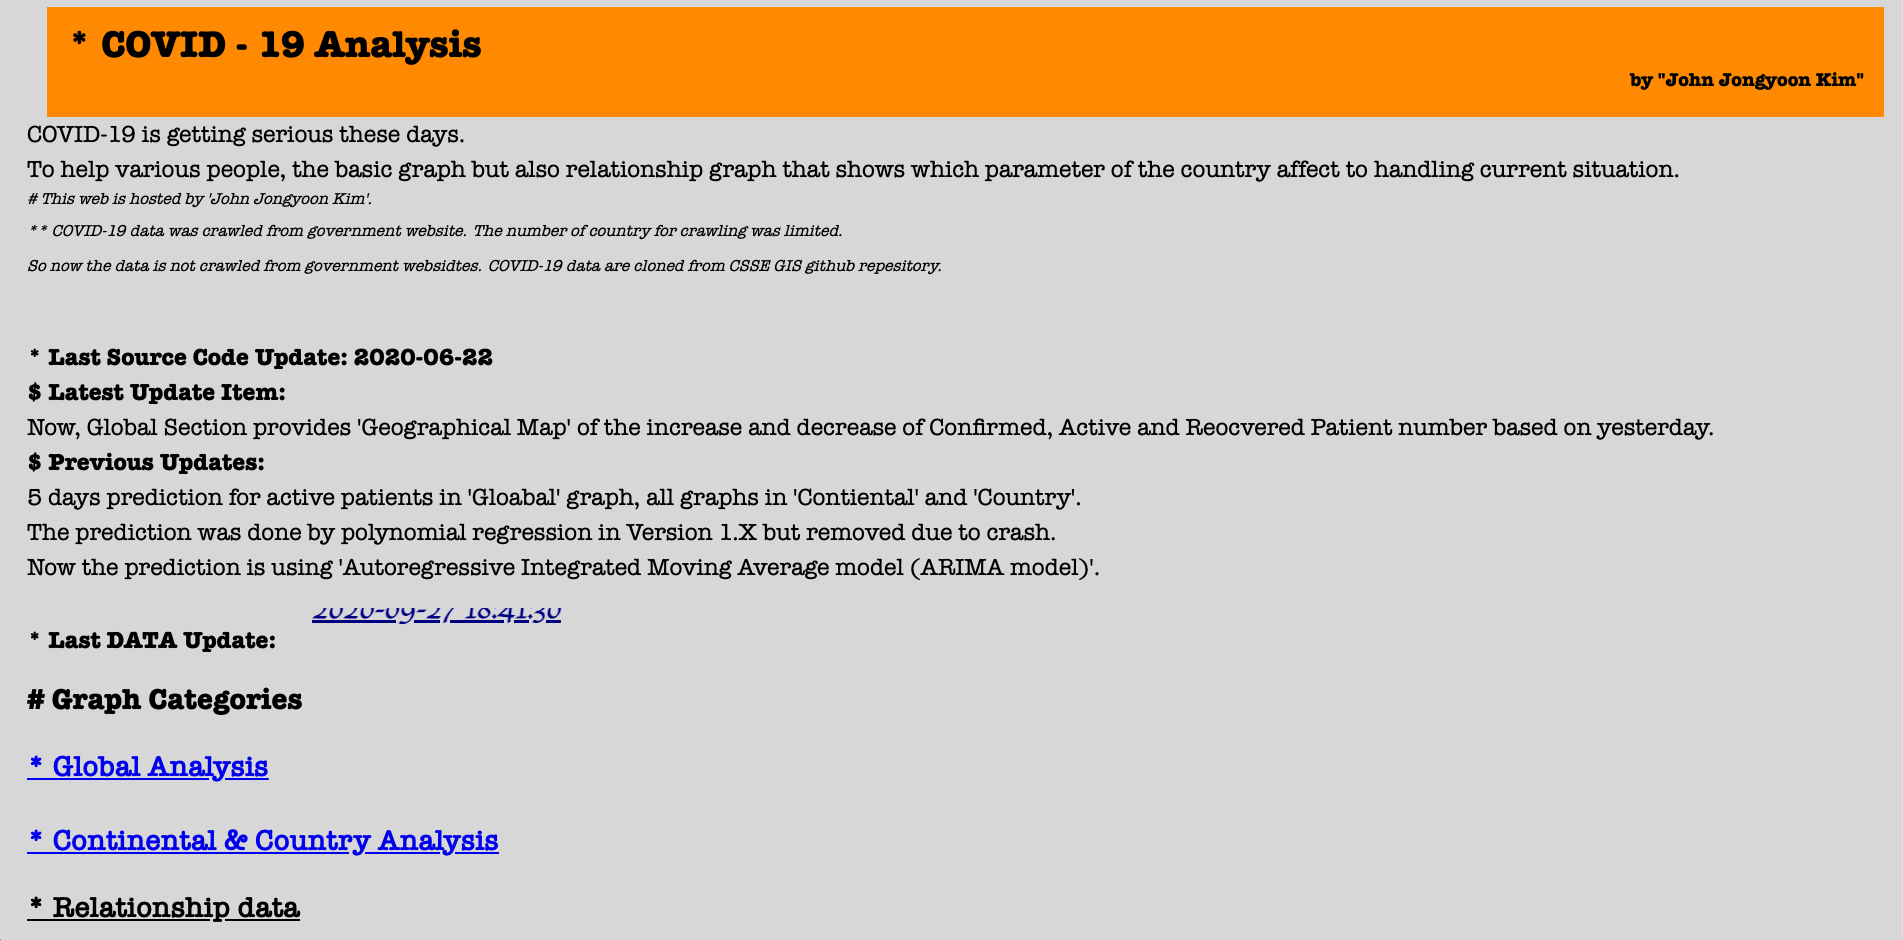
Explanation
This project is initially built to provide live (daily update) information of COVID cases (confirmed, deaths, recovered).
This webpage is designed to provide largely two data.
- COVID cases information
- confirmed, deaths, recovered, removed, active (Line Graph)
- Predicted active patients (predicted with ARIMA)
- New cases (Map view)
- Correlation information
- Between General Vaccination & Recovery rate (This vaccination is not COVID vaccine.)
- Between Medical related information & Recovery rate
Technology Stacks
This webpage is built at web knowledge studying therefore all the tech stacks are out dated or low level.
- Web
- HTML and CSS only (static only)
- Hosting: apache HTTP
- Visualisation: Line graph, Map view
- plotly (python3)
- Data crawler
- python3 (github, pandas, BeautifulSoup4)
- Forecast/Prediction
- python3 (statsmodel)
Web
When I was building this webpage, I did not have any knowledge about REST API, Front-End, Back-End and Database. Therefore, all the webpage is designed only with static files such as HTML and CSS.
To achieve data visualisation, python crawler was run everyday morning and exported to plotly HTML.
The hosting of the static files are done with apache HTTP on Raspberry pi 4.
Data crawler
The data of COVID information was crawled from CSSE github page.
By git pulling the repository everyday, CSV files that contains data are updated.
With pandas, the csv format data are imported to python.
For medical related data and
Visualisation
As illustrated on Web section, the visualisation of data is done by plotly library on python. The data is loaded via pandas and the visualisation result is exported as format of HTML with javascript.
Forecast/Prediction
The short-term (7days) forecast of active patient is processed with ARIMA model (statsmodel library). The model was initially built with SEIR model which is often used on epidemiology papers. However, the model is not well fit to this pendemic situation so other mathematical model, ARIMA is used.
Page Map
- Main (index.html)
- Global
- COVID pages
- Map view
- General Vaccination Correlation
- Medical Information Correlation
- Continental
- Africa
- countries
- …
- America
- countries
- …
- Asia
- countries
- …
- Europe
- countries
- …
- Oceania
- countries
- …
- Africa
- Global
Further
During Summer internship (2020) in NAVER corp, I have learned how to organise webpage.
Therefore, this project has been renewed to version2 and 3 by applying some latest technology stacks.
As this page is built with static files, this is now archived on github repository which is last updated on 2020-09-27 18:41:30. This page is now no longer updated.
